Random Vibration Test of a Motherboard
Background
Electronic components are frequently situated in environments where they encounter vibrations. In many cases, conducting vibration tests becomes essential for these components. These tests involve securing the component onto a shaker table, subjecting it to pseudorandom acceleration. The acceleration applied follows a frequency profile specified by a power spectral density (PSD), also referred to as acceleration spectral density (ASD). To anticipate the results of such tests, conducting a simulation via random vibration analysis is feasible.
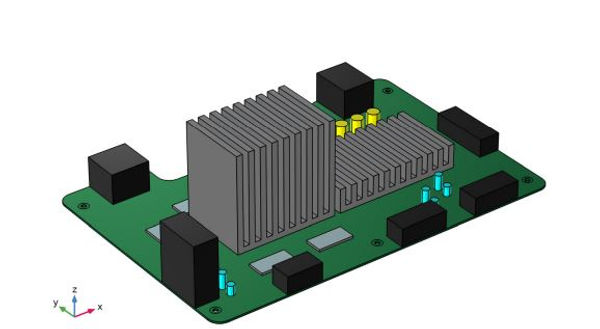
Geometry: The motherboard exhibits a typical design for smaller computer devices, featuring a CPU, GPU, memory chips, capacitors, and peripheral connectors, all intended for attachment to a housing via mounting bolts during vibration testing.
Material: The motherboard is made of generic PCB material, while heat sinks are aluminum, chips are silicon, and connectors are plastic. Effective material properties represent the capacitors.
Constraints: Mounting holes are fixed to the shaker table using rigid connectors to measure bolt forces.
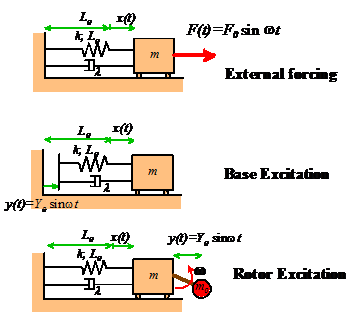
Loads: Acceleration from the shaker table, depicted by a PSD graph, is applied three times in different global directions using random vibration nodes. The test is performed three times, where the structure is independently accelerated in each of the three global directions. Thus, three different Random Vibration nodes are also used.
The acceleration cannot be explicitly prescribed for a ground motion when a modal based study is used. Instead, the Base Excitation feature is used. Base Excitation models the behavior of a vibration isolation system. The base of the spring is given a prescribed motion, causing the mass to vibrate. This system can be used to model the entire structure of the system.
Mounting Bolts: The motherboard utilizes six M3 bolts with specified properties such as stress area, mounting prestress, and friction coefficient.
Mesh: A mesh with quadratic serendipity elements, resulting in approximately 100,000 degrees of freedom, is used for eigenfrequency analysis.
Results and Discussion
Eigenfrequency analysis computes numerous eigenfrequencies and corresponding eigenmodes, with modal mass indicating mode importance. Only modes with a relative modal mass above 0.001 are included to mitigate evaluation times.
RMS accelerations in three excitation directions are plotted, emphasizing the transformation of actual accelerations into equivalent inertial forces relative to fixation points. RMS is by far my preference over peak acceleration because it is independent of the sample rate.
PSD plots illustrate frequency contributions to RMS values for absolute accelerations, particularly focusing on capacitors experiencing high accelerations.
`
Capacity of mounting bolts is assessed, considering the risk of sliding under bolt heads. Margins of safety are determined, with all bolts showing positive margins but some being relatively small, particularly for specific excitation directions.
Base Excitation nodes apply the load, and q2 and q2sq operators compute RMS values, with caution taken to ensure non-zero arguments.
Forces in bolts are evaluated using rigid connectors due to limitations in directly assessing reaction forces in fixed constraints during modal-based studies.
Finally, the mounting bolts' capacity, focusing on the risk of sliding under bolt heads, is assessed. By considering the largest allowed shear force per bolt, a safety margin is calculated, assuming a peak value exceeds the RMS by a factor of 3. Tables detailing bolt forces and safety margins are generated. While all bolts have positive safety margins, 'Bolt 2' and 'Bolt 5' show smaller margins. Despite the risk of sliding compromising the analysis, the safety margins, based on estimated peak values, validate the bolts' performance over multiple load cycles.